「normal distribution」的各地常用譯名 中國大陸 正態分布 臺灣 常態分布 港澳 常態分佈、正態分佈 日本 正規分布 韓國 正規分布
常態分布 (normal distribution ,中國大陸作正態分布 ,台灣作常態分布 ),物理學中通稱高斯分佈 (Gaussian distribution )[ 1] 連續機率分佈 。正態分佈在統計學 上十分重要,經常用在自然 和社會科學 來代表一個不明的隨機變量。[ 2] [ 3]
若隨機變量
X
{\displaystyle X}
平均數 為{"type":"standard","title":"Second voyage of HMS Beagle","displaytitle":"Second voyage of HMS Beagle ","namespace":{"id":0,"text":""},"wikibase_item":"Q1564366","titles":{"canonical":"Second_voyage_of_HMS_Beagle","normalized":"Second voyage of HMS Beagle","display":"Second voyage of HMS Beagle "},"pageid":8008600,"thumbnail":{"source":"https://upload.wikimedia.org/wikipedia/commons/thumb/2/22/HMS_Beagle_by_Conrad_Martens.jpg/320px-HMS_Beagle_by_Conrad_Martens.jpg","width":320,"height":213},"originalimage":{"source":"https://upload.wikimedia.org/wikipedia/commons/2/22/HMS_Beagle_by_Conrad_Martens.jpg","width":1235,"height":821},"lang":"en","dir":"ltr","revision":"1265642601","tid":"fd994e4c-c4a8-11ef-abe7-c756b85068cc","timestamp":"2024-12-27T23:19:16Z","description":"Scientific research mission carrying Charles Darwin (1831–1836)","description_source":"local","content_urls":{"desktop":{"page":"https://en.wikipedia.org/wiki/Second_voyage_of_HMS_Beagle","revisions":"https://en.wikipedia.org/wiki/Second_voyage_of_HMS_Beagle?action=history","edit":"https://en.wikipedia.org/wiki/Second_voyage_of_HMS_Beagle?action=edit","talk":"https://en.wikipedia.org/wiki/Talk:Second_voyage_of_HMS_Beagle"},"mobile":{"page":"https://en.m.wikipedia.org/wiki/Second_voyage_of_HMS_Beagle","revisions":"https://en.m.wikipedia.org/wiki/Special:History/Second_voyage_of_HMS_Beagle","edit":"https://en.m.wikipedia.org/wiki/Second_voyage_of_HMS_Beagle?action=edit","talk":"https://en.m.wikipedia.org/wiki/Talk:Second_voyage_of_HMS_Beagle"}},"extract":"The second voyage of HMS Beagle, from 27 December 1831 to 2 October 1836, was the second survey expedition of HMS Beagle, made under her newest commander, Robert FitzRoy. FitzRoy had thought of the advantages of having someone onboard who could investigate geology, and sought a naturalist to accompany them as a supernumerary. At the age of 22, the graduate Charles Darwin hoped to see the tropics before becoming a parson, and accepted the opportunity. He was greatly influenced by reading Charles Lyell's Principles of Geology during the voyage. By the end of the expedition, Darwin had made his name as a geologist, and fossil collector, and the publication of his journal gave him wide renown as a writer.","extract_html":"The second voyage of HMS Beagle , from 27 December 1831 to 2 October 1836, was the second survey expedition of HMS Beagle , made under her newest commander, Robert FitzRoy. FitzRoy had thought of the advantages of having someone onboard who could investigate geology, and sought a naturalist to accompany them as a supernumerary . At the age of 22, the graduate Charles Darwin hoped to see the tropics before becoming a parson, and accepted the opportunity. He was greatly influenced by reading Charles Lyell's Principles of Geology during the voyage. By the end of the expedition, Darwin had made his name as a geologist, and fossil collector, and the publication of his journal gave him wide renown as a writer.
"} 標準差 為
σ
{\displaystyle \sigma }
X
∼
N
(
μ
,
σ
2
)
,
{\displaystyle X\sim N(\mu ,\sigma ^{2}),}
[ 4] 則其機率密度函數 為
f
(
x
)
=
1
σ
2
π
e
−
(
x
−
μ
)
2
2
σ
2
{\displaystyle f(x)={\frac {1}{\sigma {\sqrt {2\pi }}}}\;e^{-{\frac {\left(x-\mu \right)^{2}}{2\sigma ^{2}}}}\!}
[ 4] [ 5]
正態分佈的數學期望值 值或期望值
μ
{\displaystyle \mu }
方差
σ
2
{\displaystyle \sigma ^{2}}
標準差
σ
{\displaystyle \sigma }
[ 5]
中心極限定理 指出,在特定條件下,一個具有有限均值 和方差 的隨機變量 的多個樣本 (觀察值)的平均值本身就是一個隨機變量,其分佈隨着樣本數量的增加而收斂 於正態分佈。因此,許多與獨立過程總和有關的物理量,例如測量誤差,通常可被近似為正態分佈。
正態分佈的機率密度函數曲線呈鐘形,因此人們又經常稱之為鐘形曲線 (類似於寺廟裏的大鐘 ,因此得名)。我們通常所說的標準正態分佈 是位置參數
μ
=
0
{\displaystyle \mu =0}
σ
2
=
1
{\displaystyle \sigma ^{2}=1}
[ 5]
正態分佈是自然科學 與行為科學 中的定量現象的一個方便模型。各種各樣的心理學 測試分數和物理 現象比如光子 計數都被發現近似地服從正態分佈。儘管這些現象的根本原因經常是未知的,理論上可以證明如果把許多小作用加起來看做一個變量,那麼這個變量服從正態分佈(在R.N.Bracewell的Fourier transform and its application中可以找到一種簡單的證明)。正態分佈出現在許多區域統計 :例如,採樣分佈 均值 是近似地正態的,即使被採樣的樣本的原始群體分佈並不服從正態分佈。另外,正態分佈資訊熵 在所有的已知均值及方差的分佈中最大,這使得它作為一種均值 以及方差 已知的分佈的自然選擇。正態分佈是在統計以及許多統計測試中最廣泛應用的一類分佈。在機率論 ,正態分佈是幾種連續以及離散分佈的極限 分佈。
正態分佈最早是狄默夫 在1718年著作的書籍的(Doctrine of Change ),及1734年發表的一篇關於二項分佈 文章中提出的,當二項隨機變量的位置參數n很大及形狀參數p為1/2時,則所推導出二項分佈的近似分佈函數就是正態分佈。拉普拉斯 在1812年發表的《分析機率論》(Theorie Analytique des Probabilites )中對棣莫佛的結論作了擴展到二項分佈的位置參數為n及形狀參數為1>p>0時。現在這一結論通常被稱為棣莫佛-拉普拉斯定理 。
拉普拉斯在誤差 分析試驗中使用了正態分佈。勒讓德 於1805年引入最小平方法 這一重要方法;而高斯 則宣稱他早在1794年就使用了該方法,並通過假設誤差服從正態分佈給出了嚴格的證明。
將正態分佈稱作「鐘形曲線」的習慣可以追溯到Jouffret 他在1872年首次提出這個術語(Bell curve)用來指代二元正態分佈 。正態分佈這個名字還被查爾斯·皮爾士 、法蘭西斯·高爾頓 、威爾赫姆·萊克希斯 在1875分別獨立地使用。這個術語是不幸的,因為它反映和鼓勵了一種謬誤,即很多機率分佈都是正態的。(請參考下面的「實例」)
這個分佈被稱為「正態」或者「高斯」正好是史蒂格勒名字由來法則 的一個例子,這個法則說「沒有科學發現是以它最初的發現者命名的」。
有幾種不同的方法用來說明一個隨機變量。最直觀的方法是機率密度函數 ,這種方法能夠表示隨機變量每個取值有多大的可能性。累積分佈函數 是一種機率上更加清楚的方法,請看下邊的例子。還有一些其他的等價方法,例如cumulant、特徵函數 、矩生成函數 以及cumulant-生成函數 。這些方法中有一些對於理論工作非常有用,但是不夠直觀。請參考關於機率分佈 的討論。
四個不同參數集的機率密度函數(紅色線代表標準正態分佈) 正態分佈 的機率密度函數 均值為
μ
{\displaystyle \mu }
方差 為
σ
2
{\displaystyle \sigma ^{2}}
標準差
σ
{\displaystyle \sigma }
高斯函數 的一個實例:
f
(
x
;
μ
,
σ
)
=
1
σ
2
π
exp
(
−
(
x
−
μ
)
2
2
σ
2
)
{\displaystyle f(x;\mu ,\sigma )={\frac {1}{\sigma {\sqrt {2\pi }}}}\,\exp \left(-{\frac {(x-\mu )^{2}}{2\sigma ^{2}}}\right)}
(請看指數函數 以及
π
{\displaystyle \pi }
)
如果一個隨機變量
X
{\displaystyle X}
X
{\displaystyle X}
N
(
μ
,
σ
2
)
{\displaystyle N(\mu ,\sigma ^{2})}
μ
=
0
{\displaystyle \mu =0}
σ
=
1
{\displaystyle \sigma =1}
標準正態分佈 ,這個分佈能夠簡化為
f
(
x
)
=
1
2
π
exp
(
−
x
2
2
)
{\displaystyle f(x)={\frac {1}{\sqrt {2\pi }}}\,\exp \left(-{\frac {x^{2}}{2}}\right)}
右邊是給出了不同參數的正態分佈的函數圖。
正態分佈中一些值得注意的量:
密度函數關於平均值對稱
平均值與它的眾數 (statistical mode)以及中位數 (median)同一數值。
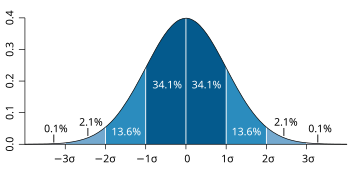
函數曲線下68.268949%的面積在平均數左右的一個標準差 範圍內。
95.449974%的面積在平均數左右兩個標準差
2
σ
{\displaystyle 2\sigma }
99.730020%的面積在平均數左右三個標準差
3
σ
{\displaystyle 3\sigma }
99.993666%的面積在平均數左右四個標準差
4
σ
{\displaystyle 4\sigma }
函數曲線的拐點 (inflection point)為離平均數一個標準差距離的位置。 上圖所示的機率密度函數的累積分佈函數 累積分佈函數 是指隨機變量
X
{\displaystyle X}
x
{\displaystyle x}
F
(
x
;
μ
,
σ
)
=
1
σ
2
π
∫
−
∞
x
exp
(
−
(
t
−
μ
)
2
2
σ
2
)
d
t
.
{\displaystyle F(x;\mu ,\sigma )={\frac {1}{\sigma {\sqrt {2\pi }}}}\int _{-\infty }^{x}\exp \left(-{\frac {(t-\mu )^{2}}{2\sigma ^{2}}}\ \right)\,dt.}
正態分佈的累積分佈函數能夠由一個叫做誤差函數 的特殊函數 表示:
Φ
(
z
)
=
1
2
[
1
+
erf
(
z
−
μ
σ
2
)
]
.
{\displaystyle \Phi (z)={\frac {1}{2}}\left[1+\operatorname {erf} \left({\frac {z-\mu }{\sigma {\sqrt {2}}}}\right)\right].}
標準正態分佈 的累積分佈函數習慣上記為
Φ
{\displaystyle \Phi }
是指
μ
=
0
{\displaystyle \mu =0}
σ
=
1
{\displaystyle \sigma =1}
的值,
Φ
(
x
)
=
F
(
x
;
0
,
1
)
=
1
2
π
∫
−
∞
x
exp
(
−
t
2
2
)
d
t
.
{\displaystyle \Phi (x)=F(x;0,1)={\frac {1}{\sqrt {2\pi }}}\int _{-\infty }^{x}\exp \left(-{\frac {t^{2}}{2}}\right)\,dt.}
將一般正態分佈用誤差函數 表示的公式簡化,可得:
Φ
(
z
)
=
1
2
[
1
+
erf
(
z
2
)
]
.
{\displaystyle \Phi (z)={\frac {1}{2}}\left[1+\operatorname {erf} \left({\frac {z}{\sqrt {2}}}\right)\right].}
它的反函數 被稱為反誤差函數,為:
Φ
−
1
(
p
)
=
2
erf
−
1
(
2
p
−
1
)
.
{\displaystyle \Phi ^{-1}(p)={\sqrt {2}}\;\operatorname {erf} ^{-1}\left(2p-1\right).}
該分位數函數有時也被稱為probit 函數。probit 函數已被證明沒有初等原函數。
正態分佈的分佈函數
Φ
(
x
)
{\displaystyle \Phi (x)}
,它的值可以通過數值積分 、泰勒級數 或者漸進序列 近似得到。
矩生成函數 ,或稱矩母函數被定義為
exp
(
t
X
)
{\displaystyle \exp(tX)}
正態分佈的矩產生函數如下:
M
X
(
t
)
{\displaystyle M_{X}(t)\,}
=
E
(
e
t
X
)
{\displaystyle =\mathrm {E} \left(e^{tX}\right)}
=
∫
−
∞
∞
1
σ
2
π
e
(
−
(
x
−
μ
)
2
2
σ
2
)
e
t
x
d
x
{\displaystyle =\int _{-\infty }^{\infty }{\frac {1}{\sigma {\sqrt {2\pi }}}}e^{\left(-{\frac {(x-\mu )^{2}}{2\sigma ^{2}}}\right)}e^{tx}\,dx}
=
e
(
μ
t
+
σ
2
t
2
2
)
{\displaystyle =e^{\left(\mu t+{\frac {\sigma ^{2}t^{2}}{2}}\right)}}
可以通過在指數函數內配平方得到。
特徵函數 被定義為
exp
(
i
t
X
)
{\displaystyle \exp(itX)}
期望值 ,其中
i
{\displaystyle i}
ϕ
X
(
t
;
μ
,
σ
)
{\displaystyle \phi _{X}(t;\mu ,\sigma )\!}
=
E
[
exp
(
i
t
X
)
]
{\displaystyle =\mathrm {E} \left[\exp(itX)\right]}
=
∫
−
∞
∞
1
σ
2
π
exp
(
−
(
x
−
μ
)
2
2
σ
2
)
exp
(
i
t
x
)
d
x
{\displaystyle =\int _{-\infty }^{\infty }{\frac {1}{\sigma {\sqrt {2\pi }}}}\exp \left(-{\frac {(x-\mu )^{2}}{2\sigma ^{2}}}\right)\exp(itx)\,dx}
=
exp
(
i
μ
t
−
σ
2
t
2
2
)
.
{\displaystyle =\exp \left(i\mu t-{\frac {\sigma ^{2}t^{2}}{2}}\right).}
把矩生成函數中的
t
{\displaystyle t}
i
t
{\displaystyle it}
正態分佈的一些性質:
如果
X
∼
N
(
μ
,
σ
2
)
{\displaystyle X\sim N(\mu ,\sigma ^{2})\,}
a
{\displaystyle a}
b
{\displaystyle b}
實數 ,那麼
a
X
+
b
∼
N
(
a
μ
+
b
,
(
a
σ
)
2
)
{\displaystyle aX+b\sim N(a\mu +b,(a\sigma )^{2})}
期望值 和方差 ).
如果
X
∼
N
(
μ
X
,
σ
X
2
)
{\displaystyle X\sim N(\mu _{X},\sigma _{X}^{2})}
Y
∼
N
(
μ
Y
,
σ
Y
2
)
{\displaystyle Y\sim N(\mu _{Y},\sigma _{Y}^{2})}
統計獨立 的正態隨機變量 ,那麼:
它們的和也滿足正態分佈
U
=
X
+
Y
∼
N
(
μ
X
+
μ
Y
,
σ
X
2
+
σ
Y
2
)
{\displaystyle U=X+Y\sim N(\mu _{X}+\mu _{Y},\sigma _{X}^{2}+\sigma _{Y}^{2})}
proof
它們的差也滿足正態分佈
V
=
X
−
Y
∼
N
(
μ
X
−
μ
Y
,
σ
X
2
+
σ
Y
2
)
{\displaystyle V=X-Y\sim N(\mu _{X}-\mu _{Y},\sigma _{X}^{2}+\sigma _{Y}^{2})}
U
{\displaystyle U}
V
{\displaystyle V}
如果
X
∼
N
(
0
,
σ
X
2
)
{\displaystyle X\sim N(0,\sigma _{X}^{2})}
Y
∼
N
(
0
,
σ
Y
2
)
{\displaystyle Y\sim N(0,\sigma _{Y}^{2})}
它們的積
X
Y
{\displaystyle XY}
p
{\displaystyle p}
p
(
z
)
=
1
π
σ
X
σ
Y
K
0
(
|
z
|
σ
X
σ
Y
)
,
{\displaystyle p(z)={\frac {1}{\pi \,\sigma _{X}\,\sigma _{Y}}}\;K_{0}\left({\frac {|z|}{\sigma _{X}\,\sigma _{Y}}}\right),}
K
0
{\displaystyle K_{0}}
它們的比符合柯西分佈 ,滿足
X
/
Y
∼
C
a
u
c
h
y
(
0
,
σ
X
/
σ
Y
)
{\displaystyle X/Y\sim \mathrm {Cauchy} (0,\sigma _{X}/\sigma _{Y})}
如果
X
1
,
⋯
,
X
n
{\displaystyle X_{1},\cdots ,X_{n}}
X
1
2
+
⋯
+
X
n
2
{\displaystyle X_{1}^{2}+\cdots +X_{n}^{2}}
n 的卡方分佈 。 一些正態分佈的一階矩如下:
階數
原動差
主動差
累積量
0
1
0
1
μ
{\displaystyle \mu }
0
μ
{\displaystyle \mu }
2
μ
2
+
σ
2
{\displaystyle \mu ^{2}+\sigma ^{2}}
σ
2
{\displaystyle \sigma ^{2}}
σ
2
{\displaystyle \sigma ^{2}}
3
μ
3
+
3
μ
σ
2
{\displaystyle \mu ^{3}+3\mu \sigma ^{2}}
0
0
4
μ
4
+
6
μ
2
σ
2
+
3
σ
4
{\displaystyle \mu ^{4}+6\mu ^{2}\sigma ^{2}+3\sigma ^{4}}
3
σ
4
{\displaystyle 3\sigma ^{4}}
0
標準正態的所有二階以上的累積量 為零。
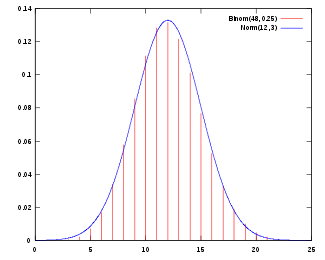
正態分佈的機率密度函數,參數為μ = 12,σ = 3,趨近於n = 48、p = 1/4的二項分佈 的機率質量函數。 正態分佈有一個非常重要的性質:在特定條件下,大量統計獨立 的隨機變量的平均值的分佈趨於正態分佈,這就是中心極限定理
參數為
n
{\displaystyle n}
p
{\displaystyle p}
二項分佈 ,在
n
{\displaystyle n}
p
{\displaystyle p}
(有的參考書建議僅在
n
p
{\displaystyle np}
n
(
1
−
p
)
{\displaystyle n(1-p)}
近似正態分佈平均數為
μ
=
n
p
{\displaystyle \mu =np}
σ
2
=
n
p
(
1
−
p
)
{\displaystyle \sigma ^{2}=np(1-p)}
一泊松分佈 帶有參數
λ
{\displaystyle \lambda }
λ
{\displaystyle \lambda }
.近似正態分佈平均數為
μ
=
λ
{\displaystyle \mu =\lambda }
σ
2
=
λ
{\displaystyle \sigma ^{2}=\lambda }
這些近似值是否完全充分正確取決於使用者的使用需求
正態分佈是無限可分 的機率分佈。
正態分佈是嚴格穩定 的機率分佈。
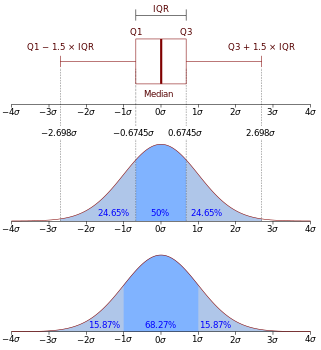
深藍色區域是距平均值小於一個標準差之內的數值範圍。在正態分佈 中,此範圍所佔比率為全部數值之68% ,根據正態分佈,兩個標準差之內的比率合起來為95% ;三個標準差之內的比率合起來為99% 。 在實際應用上,常考慮一組數據具有近似於正態分佈 的機率分佈。若其假設正確,則約68.3% 數值分佈在距離平均值有1個標準差之內的範圍,約95.4% 數值分佈在距離平均值有2個標準差之內的範圍,以及約99.7% 數值分佈在距離平均值有3個標準差之內的範圍。稱為「68-95-99.7法則 經驗法則 」。
數字比率
機率
包含之外比例
百分比
百分比
比例
6999318639000000000♠ 0.318639 σ
25%
75%
3 / 4
6999674490000000000♠ 0.674490 σ
7001500000000000000♠ 507001500000000000000♠ 501 / 7000200000000000000♠ 2
6999994458000000000♠ 0.994458 σ
68%
32%
1 / 3.125
1σ
7001682689492000000♠ 68.2689492 7001317310508000000♠ 31.7310508 1 / 7000315148720000000♠ 3.1514872
7000128155200000000♠ 1.281552 σ
80%
20%
1 / 5
7000164485400000000♠ 1.644854 σ
90%
10%
1 / 10
7000195996400000000♠ 1.959964 σ
95%
5%
1 / 20
2σ
7001954499736000000♠ 95.4499736 7000455002640000000♠ 4.5500264 1 / 7001219778950000000♠ 21.977895
7000257582900000000♠ 2.575829 σ
99%
1%
1 / 100
3σ
7001997300204000000♠ 99.7300204 6999269979600000000♠ 0.2699796 1 / 370.398
7000329052700000000♠ 3.290527 σ
99.9%
0.1%
1 / 7003100000000000000♠ 1000
7000389059200000000♠ 3.890592 σ
99.99%
0.01%
1 / 7004100000000000000♠ 10000
4σ
7001999936660000000♠ 99.993666 6997633400000000000♠ 0.006334 1 / 7004157870000000000♠ 15787
7000441717300000000♠ 4.417173 σ
99.999%
0.001%
1 / 7005100000000000000♠ 100000
7000450000000000000♠ 4.5σ
99.999320 465 3751%
0.000679 534 6249%
1 / 7005147159535800000♠ 147159 .53587006100000000000000♠ 1000 000 每一邊 )
7000489163800000000♠ 4.891638 σ
7001999999000000000♠ 99.99996996100000000000000♠ 0.00011 / 7006100000000000000♠ 1000 000
5σ
7001999999426697000♠ 99.999942 6697 6995573303000000000♠ 0.000057 3303 1 / 7006174427800000000♠ 1744 278
7000532672399999999♠ 5.326724 σ
7001999999900000000♠ 99.99999 6995100000000000000♠ 0.00001 1 / 7007100000000000000♠ 10000 000
7000573072900000000♠ 5.730729 σ
7001999999990000000♠ 99.999999 6994100000000000000♠ 0.000001 1 / 7008100000000000000♠ 100000 000
7000600000000000000♠ 6σ 7001999999998027000♠ 99.999999 8027 6993197300000000000♠ 0.000000 1973 1 / 7008506797346000000♠ 506797 346
7000610941000000000♠ 6.109410 σ
7001999999999000000♠ 99.9999999 6993100000000000000♠ 0.0000001 1 / 7009100000000000000♠ 1000 000 000
7000646695100000000♠ 6.466951 σ
7001999999999900000♠ 99.999999 99 6992100000000000000♠ 0.000000 01 1 / 7010100000000000000♠ 10000 000 000
7000680650200000000♠ 6.806502 σ
7001999999999990000♠ 99.999999 999 6991100000000000000♠ 0.000000 001 1 / 7011100000000000000♠ 100000 000 000
7σ
99.999999 999 7440%
6990256000000000000♠ 0.000000 000 256 1 / 7011390682215445000♠ 390682 215 445
R
∼
R
a
y
l
e
i
g
h
(
σ
)
{\displaystyle R\sim \mathrm {Rayleigh} (\sigma )}
瑞利分佈 ,如果
R
=
X
2
+
Y
2
{\displaystyle R={\sqrt {X^{2}+Y^{2}}}}
X
∼
N
(
0
,
σ
2
)
{\displaystyle X\sim N(0,\sigma ^{2})}
Y
∼
N
(
0
,
σ
2
)
{\displaystyle Y\sim N(0,\sigma ^{2})}
Y
∼
χ
ν
2
{\displaystyle Y\sim \chi _{\nu }^{2}}
卡方分佈 具有
ν
{\displaystyle \nu }
自由度 ,如果
Y
=
∑
k
=
1
ν
X
k
2
{\displaystyle Y=\sum _{k=1}^{\nu }X_{k}^{2}}
X
k
∼
N
(
0
,
1
)
{\displaystyle X_{k}\sim N(0,1)}
k
=
1
,
…
,
ν
{\displaystyle k=1,\dots ,\nu }
Y
∼
C
a
u
c
h
y
(
μ
=
0
,
θ
=
1
)
{\displaystyle Y\sim \mathrm {Cauchy} (\mu =0,\theta =1)}
柯西分佈 ,如果
Y
=
X
1
/
X
2
{\displaystyle Y=X_{1}/X_{2}}
X
1
∼
N
(
0
,
1
)
{\displaystyle X_{1}\sim N(0,1)}
X
2
∼
N
(
0
,
1
)
{\displaystyle X_{2}\sim N(0,1)}
Y
∼
Log-N
(
μ
,
σ
2
)
{\displaystyle Y\sim {\mbox{Log-N}}(\mu ,\sigma ^{2})}
對數正態分佈 如果
Y
=
e
X
{\displaystyle Y=e^{X}}
X
∼
N
(
μ
,
σ
2
)
{\displaystyle X\sim N(\mu ,\sigma ^{2})}
與Lévy skew alpha-stable分佈 相關:如果
X
∼
Levy-S
α
S
(
2
,
β
,
σ
/
2
,
μ
)
{\displaystyle X\sim {\textrm {Levy-S}}\alpha {\textrm {S}}(2,\beta ,\sigma /{\sqrt {2}},\mu )}
X
∼
N
(
μ
,
σ
2
)
{\displaystyle X\sim N(\mu ,\sigma ^{2})}
多元正態分佈 的協方差矩陣 的估計的推導是比較難於理解的。它需要瞭解譜原理 (spectral theorem)以及為什麼把一個標量 看做一個1×1矩陣 的跡(trace)而不僅僅是一個標量更合理的原因。請參考協方差矩陣的估計 (estimation of covariance matrices)。
某飲料公司裝瓶流程嚴謹,每罐飲料裝填量符合平均600毫升,標準差3毫升的正態分配法則。隨機選取一罐,求(1)容量超過605毫升的機率;(2)容量小於590毫升的機率。
容量超過605毫升的機率 = p ( X > 605)= p ( ((X-μ) /σ) > ( (605 – 600) / 3) )= p ( Z > 5/3) = p( Z > 1.67) = 1 - 0.9525 = 0.0475
容量小於590毫升的機率 = p (X < 590) = p ( ((X-μ) /σ) < ( (590 – 600) / 3) )= p ( Z < -10/3) = p( Z < -3.33) = 0.0004
6-標準差 (6-sigma或6-σ)的品質管制標準
6-標準差(6-sigma或6-σ),是製造業流行的品質管制標準。在這個標準之下,一個標準正態分配的變量值出現在正負三個標準差之外,只有2* 0.0013= 0.0026 (p (Z < -3) = 0.0013以及p(Z > 3) = 0.0013)。也就是說,這種品質管制標準的產品不良率只有萬分之二十六。假設例中的飲料公司裝瓶流程採用這個標準,而每罐飲料裝填量符合平均600毫升,標準差3毫升的正態分配。那麼預期裝填容量的範圍應該多少?
6-標準差的範圍 = p ( -3 < Z < 3)= p ( - 3 < (X-μ) /σ < 3) = p ( -3 < (X- 600) / 3 < 3)= p ( -9 < X – 600 < 9) = p (591 < X < 609)
因此,預期裝填容量應該介於591至609毫升之間。
假設某校入學新生的智力測驗平均分數與標準差分別為100與12。那麼隨機抽取50個學生,他們智力測驗平均分數大於105的機率?小於90的機率?
本例沒有正態分配的假設,還好中心極限定理提供一個可行解,那就是當隨機樣本長度超過30,樣本平均數
x
¯
{\displaystyle {\bar {x}}}
因此標準正態變量
Z
=
X
¯
−
μ
σ
/
n
{\displaystyle Z={\frac {{\bar {X}}-\mu }{\sigma /{\sqrt {n}}}}}
平均分數大於105的機率
P
(
Z
>
105
−
100
12
/
50
)
=
P
(
Z
>
5
/
1.7
)
=
P
(
Z
>
2.94
)
=
0.0016
{\displaystyle P(Z>{\frac {105-100}{12/{\sqrt {50}}}})=P(Z>5/1.7)=P(Z>2.94)=0.0016}
平均分數小於90的機率
P
(
Z
<
90
−
100
12
/
50
)
=
P
(
Z
<
−
5.88
)
=
0.0000
{\displaystyle P(Z<{\frac {90-100}{12/{\sqrt {50}}}})=P(Z<-5.88)=0.0000}
在計算機模擬中,經常需要生成正態分佈的數值。最基本的一個方法是使用標準的正態累積分佈函數的反函數。除此之外還有其他更加高效的方法,Box-Muller轉換就是其中之一。另一個更加快捷的方法是ziggurat算法。下面將介紹這兩種方法。一個簡單可行的並且容易編程的方法是:求12個在(0,1)上均勻分佈的和,然後減6(12的一半)。這種方法可以用在很多應用中。這12個數的和是Irwin-Hall分佈;選擇一個方差12。這個隨即推導的結果限制在(-6,6)之間,並且密度為12,是用11次多項式估計正態分佈。
Box-Muller方法是以兩組獨立的隨機數U和V,這兩組數在(0,1]上均勻分佈,用U和V生成兩組獨立的標準正態分佈隨機變量X和Y:
X
=
−
2
ln
U
cos
(
2
π
V
)
,
{\displaystyle X={\sqrt {-2\ln U}}\,\cos(2\pi V),}
Y
=
−
2
ln
U
sin
(
2
π
V
)
{\displaystyle Y={\sqrt {-2\ln U}}\,\sin(2\pi V)}
這個方程的提出是因為二自由度的卡方分佈 (見性質4)很容易由指數隨機變量(方程中的lnU)生成。因而通過隨機變量V可以選擇一個均勻環繞圓圈的角度,用指數分佈選擇半徑然後轉換成(正態分佈的)x,y坐標。
John Aldrich. Earliest Uses of Symbols in Probability and Statistics .網上材料,2006年6月3日存在.(See "Symbols associated with the Normal Distribution". )
Abraham de Moivre (1738年). The Doctrine of Chances Stephen Jay Gould (1981年). The Mismeasure of Man ISBN 978-0-393-01489-1 .R. J. Herrnstein and Charles Murray (1994年). The Bell Curve : Intelligence and Class Structure in American LifeFree Press . ISBN 978-0-02-914673-6 .Pierre-Simon Laplace (1812年). Analytical Theory of Probabilities Jeff Miller, John Aldrich, et al. Earliest Known Uses of Some of the Words of Mathematics . In particular, the entries for "bell-shaped and bell curve" , "normal" (distribution) , "Gaussian" , and "Error, law of error, theory of errors, etc." .網上材料,2006年6月3日存在
S. M. Stigler (1999年). Statistics on the Table , chapter 22. Harvard University Press. (History of the term "normal distribution". )
Eric W. Weisstein et al. Normal Distribution (頁面存檔備份 ,存於互聯網檔案館 ) at MathWorld .網上材料,2006年6月3日存在。Marvin Zelen and Norman C. Severo (1964年). Probability Functions. Chapter 26 of Handbook of Mathematical Functions with Formulas, Graphs, and Mathematical Tables Milton Abramowitz and Irene A. Stegun . National Bureau of Standards .


![{\displaystyle \Phi (z)={\frac {1}{2}}\left[1+\operatorname {erf} \left({\frac {z-\mu }{\sigma {\sqrt {2}}}}\right)\right].}](https://wikimedia.org/api/rest_v1/media/math/render/svg/bbbfb0d7d4f08fe1c4d0e13a840838636797a3c2)


![{\displaystyle \Phi (z)={\frac {1}{2}}\left[1+\operatorname {erf} \left({\frac {z}{\sqrt {2}}}\right)\right].}](https://wikimedia.org/api/rest_v1/media/math/render/svg/bc207a97dbcecd9eac86cabd73cf457bbade004e)


![{\displaystyle =\mathrm {E} \left[\exp(itX)\right]}](https://wikimedia.org/api/rest_v1/media/math/render/svg/1a4140011d38a1e349c13b956214f6ec71dfab88)


