File:NonConvex.gif
頁面內容不支援其他語言。
外觀
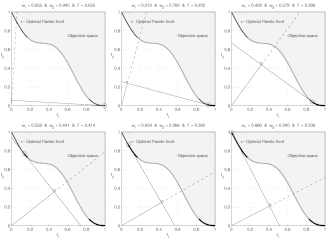
NonConvex.gif (360 × 392 像素,檔案大小:782 KB,MIME 類型:image/gif、循環、84 畫格、4.2秒)
The weighted-sum approach minimizes function 

where


such that


To have a non-convex outcome set, parameters 


Weights 


![{\displaystyle \omega _{1}\in [0;1]~}](https://wikimedia.org/api/rest_v1/media/math/render/svg/99c8913e84daf282e85b04849cc18cc14594dda7)

摘要
| 描述NonConvex.gif |
English: Weighted-sum approach is an easy method used to solve multi-objective optimization problem. It consists in aggregating the different optimization functions in a single function. However, this method only allows to find the supported solutions of the problem (i.e. points on the convex hull of the objective set). This animation shows that when the outcome set is not convex, not all efficient solutions can be found
Français : La méthode des sommes pondérées est une méthode simple pour résoudre des problèmes d'optimisation multi-objectif. Elle consiste à aggréger l'ensemble des fonctions dans une seule fonction avec différents poids. Toutefois, cette méthode permet uniquement de trouver les solutions supportées (càd les points non-dominés appartenant à l'enveloppe convexe de l'espace d'arrivée). Cette animation montre qu'il n'est pas possible d'identifier toutes les solutions efficaces lorsque l'espace d'arrivée est n'est pas convexe. |
| 日期 | |
| 來源 | 自己的作品 |
| 作者 | Guillaume Jacquenot |
Source code (MATLAB)
function MO_Animate(varargin)
% This function generates objective space images showing why
% sum-weighted optimizer can not find all non-dominated
% solutions for non convex objective spaces in multi-ojective
% optimization
%
% Guillaume JACQUENOT

if nargin == 0
    % Simu = 'Convex';
    Simu = 'NonConvex';
    save_pictures = true;
    interpreter = 'none';
end

switch Simu
    case 'NonConvex'
        a = 0.1;
        b = 3;
        stepX = 1/200;
        stepY = 1/200;
    case 'Convex'
        a = 0.2;
        b = 1;
        stepX = 1/200;
        stepY = 1/200;
end

[X,Y] = meshgrid( 0:stepX:1,-2:stepY:2);

F1 = X;
F2 = 1+Y.^2-X-a*sin(b*pi*X);

figure;
grid on;
hold on;
box on;
axis square;
set(gca,'xtick',0:0.2:1);
set(gca,'ytick',0:0.2:1);

Ttr = get(gca,'XTickLabel');
Ttr(1,:)='0.0';
Ttr(end,:)='1.0';
set(gca,'XTickLabel',[repmat(' ',size(Ttr,1),1) Ttr]);

Ttr = get(gca,'YTickLabel');
Ttr(1,:)='0.0';
Ttr(end,:)='1.0';
set(gca,'YTickLabel',[repmat(' ',size(Ttr,1),1) Ttr]);

if strcmp(interpreter,'none')
    xlabel('f1','Interpreter','none');
    ylabel('f2','Interpreter','none','rotation',0);
else
    xlabel('f_1','Interpreter','Tex');
    ylabel('f_2','Interpreter','Tex','rotation',0);
end

set(gcf,'Units','centimeters')
set(gcf,'OuterPosition',[3 3 3+6 3+6])
set(gcf,'PaperPositionMode','auto')

[minF2,minF2_index] = min(F2);
minF2_index = minF2_index + (0:numel(minF2_index)-1)*size(X,1);

O1 = F1(minF2_index)';
O2 = minF2';

[pF,Pareto]=prtp([O1,O2]);

fill([O1( Pareto);1],[O2( Pareto);1],repmat(0.95,1,3));

text(0.45,0.75,'Objective space');
text(0.1,0.9,'\leftarrow Optimal Pareto front','Interpreter','TeX');

plot(O1( Pareto),O2( Pareto),'k-','LineWidth',2);
plot(O1(~Pareto),O2(~Pareto),'.','color',[1 1 1]*0.8);
V1 = O1( Pareto); V1 = V1(end:-1:1);
V2 = O2( Pareto); V2 = V2(end:-1:1);

O1P = O1( Pareto);
O2P = O2( Pareto);

O1PC = [O1P;max(O1P)];
O2PC = [O2P;max(O2P)];
ConvH = convhull(O1PC,O2PC);
ConvH(ConvH==numel(O2PC))=[];
c = setdiff(1:numel(O1P), ConvH);

% Non convex
O1PNC = O1PC(c);

[temp, I1] = min(O1PNC);
[temp, I2] = max(O1PNC);

if ~isempty(I1) && ~isempty(I2)
    plot(O1PC(c),O2PC(c),'-','color',[1 1 1]*0.7,'LineWidth',2);
end

p1 = (V2(1)-V2(2))/(V1(1)-V1(2));
hp = plot([0 1],[p1*(-V1(1))+V2(1) p1*(1-V1(1))+V2(1)]);
delete(hp);

Histo_X = [];
Histo_Y = [];
coeff = 0.02;
Sq1 = coeff *[0 1 1 0 0;0 0 1 1 0];
compt = 1;
for i = 2:1:length(V1)-1
    if ismember(i,ConvH)
        p1 = (V2(i+1)-V2(i-1))/(V1(i+1)-V1(i-1));
        x_inter = 1/(1+p1^2)*(p1^2*V1(i)-p1*V2(i));
        hp1 = plot([0 1],[p1*(-V1(i))+V2(i) p1*(1-V1(i))+V2(i)],'k');
        % hp2 = plot([x_inter],[-x_inter/p1],'k','Marker','.','MarkerSize',8)
        hp3 = plot([0 x_inter],[0 -x_inter/p1],'k-');
        hp4 = plot([x_inter 1],[-x_inter/p1 -1/p1],'k--');
        hp5 = plot(V1(i),V2(i),'ko','MarkerSize',10);

        % Plot the square for perpendicular lines
        alpha = atan(-1/p1);
        Mrot = [cos(alpha) -sin(alpha);sin(alpha) cos(alpha)];
        Sq_plot = repmat([x_inter;-x_inter/p1],1,5) + Mrot * Sq1;
        hp7 = plot(Sq_plot(1,:),Sq_plot(2,:),'k-');

        Histo_X = [Histo_X V1(i)];
        Histo_Y = [Histo_Y V2(i)];
        hp6 = plot(Histo_X,Histo_Y,'k.','MarkerSize',10);

        w1 = p1/(p1-1);
        w2 = 1-w1;
        Fweight_sum = V1(i)*w1+w2*V2(i);
        Fweight_sum = floor(1e3*Fweight_sum )/1e3;

        w1 = floor(1000*w1)/1e3;
        str1 = sprintf('%.3f',w1);
        str2 = sprintf('%.3f',1-w1);
        str3 = sprintf('%.3f',Fweight_sum);
        if (strcmp(str1,'0.500')||strcmp(str1,'0,500')) && strcmp(Simu,'NonConvex')
            disp('Two solutions');
        end
        title(['\omega_1 = ' str1 '  &  \omega_2 = ' str2 '  &  F = ' str3],'Interpreter','TeX');
        axis([0 1 0 1]);
        file = ['Frame' num2str(1000+compt)];
        if save_pictures
            saveas(gcf, file, 'epsc');
        end
        compt = compt +1;
        pause(0.001);
        delete(hp1);
        delete(hp3);
        delete(hp4);
        delete(hp5);
        delete(hp6);
        delete(hp7);
    end
end
disp(['Number of frames :' num2str(length(V1))]);
return;

function [A varargout]=prtp(B)
% Let Fi(X), i=1...n, are objective functions
% for minimization.
% A point X* is said to be Pareto optimal one
% if there is no X such that Fi(X)<=Fi(X*) for
% all i=1...n, with at least one strict inequality.
% A=prtp(B),
% B - m x n input matrix: B=
% [F1(X1) F2(X1) ... Fn(X1);
%  F1(X2) F2(X2) ... Fn(X2);
%  .......................
%  F1(Xm) F2(Xm) ... Fn(Xm)]
% A - an output matrix with rows which are Pareto
% points (rows) of input matrix B.
% [A,b]=prtp(B). b is a vector which contains serial
% numbers of matrix B Pareto points (rows).
% Example.
% B=[0 1 2; 1 2 3; 3 2 1; 4 0 2; 2 2 1;...
%    1 1 2; 2 1 1; 0 2 2];
% [A b]=prtp(B)
% A =
%      0     1     2
%      4     0     2
%      2     2     1
% b =
%      1     4     7
A=[]; varargout{1}=[];
sz1=size(B,1);
jj=0; kk(sz1)=0;
c(sz1,size(B,2))=0;
bb=c;
for k=1:sz1
    j=0;
    ak=B(k,:);
    for i=1:sz1
        if i~=k
            j=j+1;
            bb(j,:)=ak-B(i,:);
        end
    end
    if any(bb(1:j,:)'<0)
        jj=jj+1;
        c(jj,:)=ak;
        kk(jj)=k;
    end
end
if jj
  A=c(1:jj,:);
  varargout{1}=kk(1:jj);
else
  warning([mfilename ':w0'],...
    'There are no Pareto points. The result is an empty matrix.')
end
return;
授權條款
我,本作品的著作權持有者,決定用以下授權條款發佈本作品:

|
已授權您依據自由軟體基金會發行的無固定段落、封面文字和封底文字GNU自由文件授權條款1.2版或任意後續版本,對本檔進行複製、傳播和/或修改。該協議的副本列在GNU自由文件授權條款中。http://www.gnu.org/copyleft/fdl.htmlGFDLGNU Free Documentation Licensetruetrue |
- 您可以自由:
- 分享 – 複製、發佈和傳播本作品
- 重新修改 – 創作演繹作品
- 惟需遵照下列條件:
- 姓名標示 – 您必須指名出正確的製作者,和提供授權條款的連結,以及表示是否有對內容上做出變更。您可以用任何合理的方式來行動,但不得以任何方式表明授權條款是對您許可或是由您所使用。
- 相同方式分享 – 如果您利用本素材進行再混合、轉換或創作,您必須基於如同原先的相同或兼容的條款,來分布您的貢獻成品。
您可以選擇您需要的授權條款。
說明
添加單行說明來描述出檔案所代表的內容
在此檔案描寫的項目
描繪內容
沒有維基數據項目的某些值
創用CC姓名標示-相同方式分享1.0通用版 繁體中文 (已轉換拼寫)
創用CC姓名標示-相同方式分享2.0通用版 繁體中文 (已轉換拼寫)
創用CC姓名標示-相同方式分享2.5通用版 繁體中文 (已轉換拼寫)
8 3 2009
檔案歷史
點選日期/時間以檢視該時間的檔案版本。
| 日期/時間 | 縮圖 | 尺寸 | 使用者 | 備註 | |
|---|---|---|---|---|---|
| 目前 | 2009年3月8日 (日) 17:13 |  | 360 × 392(782 KB) | Gjacquenot | {{Information |Description={{en|1=Weighted-sum approach is an easy method used to solve multi-objective optimization problem. It consists in aggregating the different optimization functions in a single function. However, this method only allows to find th |
檔案用途
下列頁面有用到此檔案:
全域檔案使用狀況
以下其他 wiki 使用了這個檔案:
- ar.wikipedia.org 的使用狀況
- az.wikipedia.org 的使用狀況
- de.wikipedia.org 的使用狀況
- el.wikipedia.org 的使用狀況
- en.wikipedia.org 的使用狀況
- pt.wikipedia.org 的使用狀況
- ru.wikipedia.org 的使用狀況
- sr.wikipedia.org 的使用狀況


