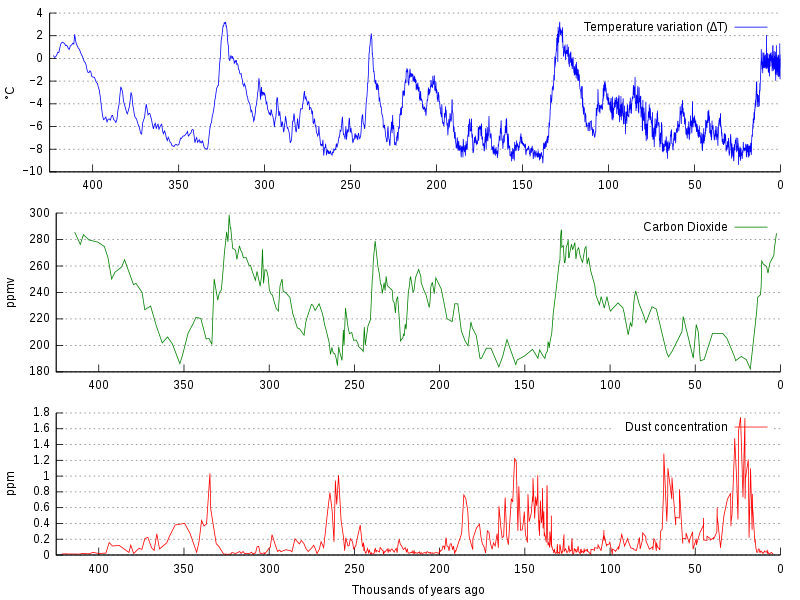
File:Vostok Petit data.svg
外观

此SVG文件的PNG预览的大小:800 × 600像素。 其他分辨率:320 × 240像素 | 640 × 480像素 | 1,024 × 768像素 | 1,280 × 960像素 | 2,560 × 1,920像素。
原始文件 (SVG文件,尺寸为1,024 × 768像素,文件大小:81 KB)
文件历史
点击某个日期/时间查看对应时刻的文件。
| 日期/时间 | 缩略图 | 大小 | 用户 | 备注 | |
|---|---|---|---|---|---|
| 当前 | 2021年6月25日 (五) 13:01 |  | 1,024 × 768(81 KB) | Matěj Orlický | File uploaded using svgtranslate tool (https://svgtranslate.toolforge.org/). Added translation for cs. |
| 2013年11月30日 (六) 22:25 |  | 1,024 × 768(77 KB) | SeL media | time axis reversed | |
| 2011年9月25日 (日) 17:39 |  | 1,024 × 768(309 KB) | Hel-hama | text improved | |
| 2011年4月27日 (三) 03:07 |  | 1,024 × 768(83 KB) | Awickert | Didn't realize that it was a draw-on box instead of a measuring-box. Take 3! | |
| 2011年4月27日 (三) 03:05 |  | 1,024 × 768(83 KB) | Awickert | [Shoot - last time, picked original instead of new version to upload] Manually moved axes in Inkscape such that the three plots line up with one another | |
| 2011年4月27日 (三) 03:02 |  | 1,024 × 768(75 KB) | Awickert | Manually moved axes in Inkscape such that the three plots line up with one another | |
| 2010年6月20日 (日) 13:25 |  | 1,024 × 768(75 KB) | Autopilot | {{Information |Description=La bildo estas kopiita de wikipedia:en. La originala priskribo estas: Graph of CO<sub>2</sub> (Green graph), temperature (Blue graph), and dust concentration (Red graph) measured from the [[Vostok, Antarc |
文件用途
以下3个页面使用本文件:
全域文件用途
以下其他wiki使用此文件:
- af.wikipedia.org上的用途
- ar.wikipedia.org上的用途
- be.wikipedia.org上的用途
- bg.wikipedia.org上的用途
- ca.wikipedia.org上的用途
- cs.wikipedia.org上的用途
- cy.wikipedia.org上的用途
- da.wikipedia.org上的用途
- de.wikipedia.org上的用途
- en.wikipedia.org上的用途
- Climate variability and change
- Global cooling
- Ice core
- Orbital forcing
- Quaternary glaciation
- Carbon dioxide in Earth's atmosphere
- Talk:Ice age/Archive 1
- File talk:Vostok Petit data.svg
- List of periods and events in climate history
- User talk:Jc-S0CO/Archives/2013/2
- User:Mark Buchanan/sandbox/QuatGlac
- User:Mark Buchanan/sandbox/Glaciation-WIP
- Portal:Climate change
- Talk:Climate variability and change/Archive 8
- en.wikiversity.org上的用途
- es.wikipedia.org上的用途
- eu.wikipedia.org上的用途
- fa.wikipedia.org上的用途
- fi.wikipedia.org上的用途
- fi.wikiversity.org上的用途
- fr.wikipedia.org上的用途
- gl.wikipedia.org上的用途
- ha.wikipedia.org上的用途
- he.wikipedia.org上的用途
- it.wikipedia.org上的用途
- it.wikibooks.org上的用途
查看此文件的更多全域用途。


