
File:Regular divisibility lattice.svg

此SVG文件的PNG预览的大小:800 × 475像素。 其他分辨率:320 × 190像素 | 640 × 380像素 | 1,024 × 608像素 | 1,280 × 760像素 | 2,560 × 1,519像素 | 1,363 × 809像素。
原始文件 (SVG文件,尺寸为1,363 × 809像素,文件大小:13 KB)
摘要
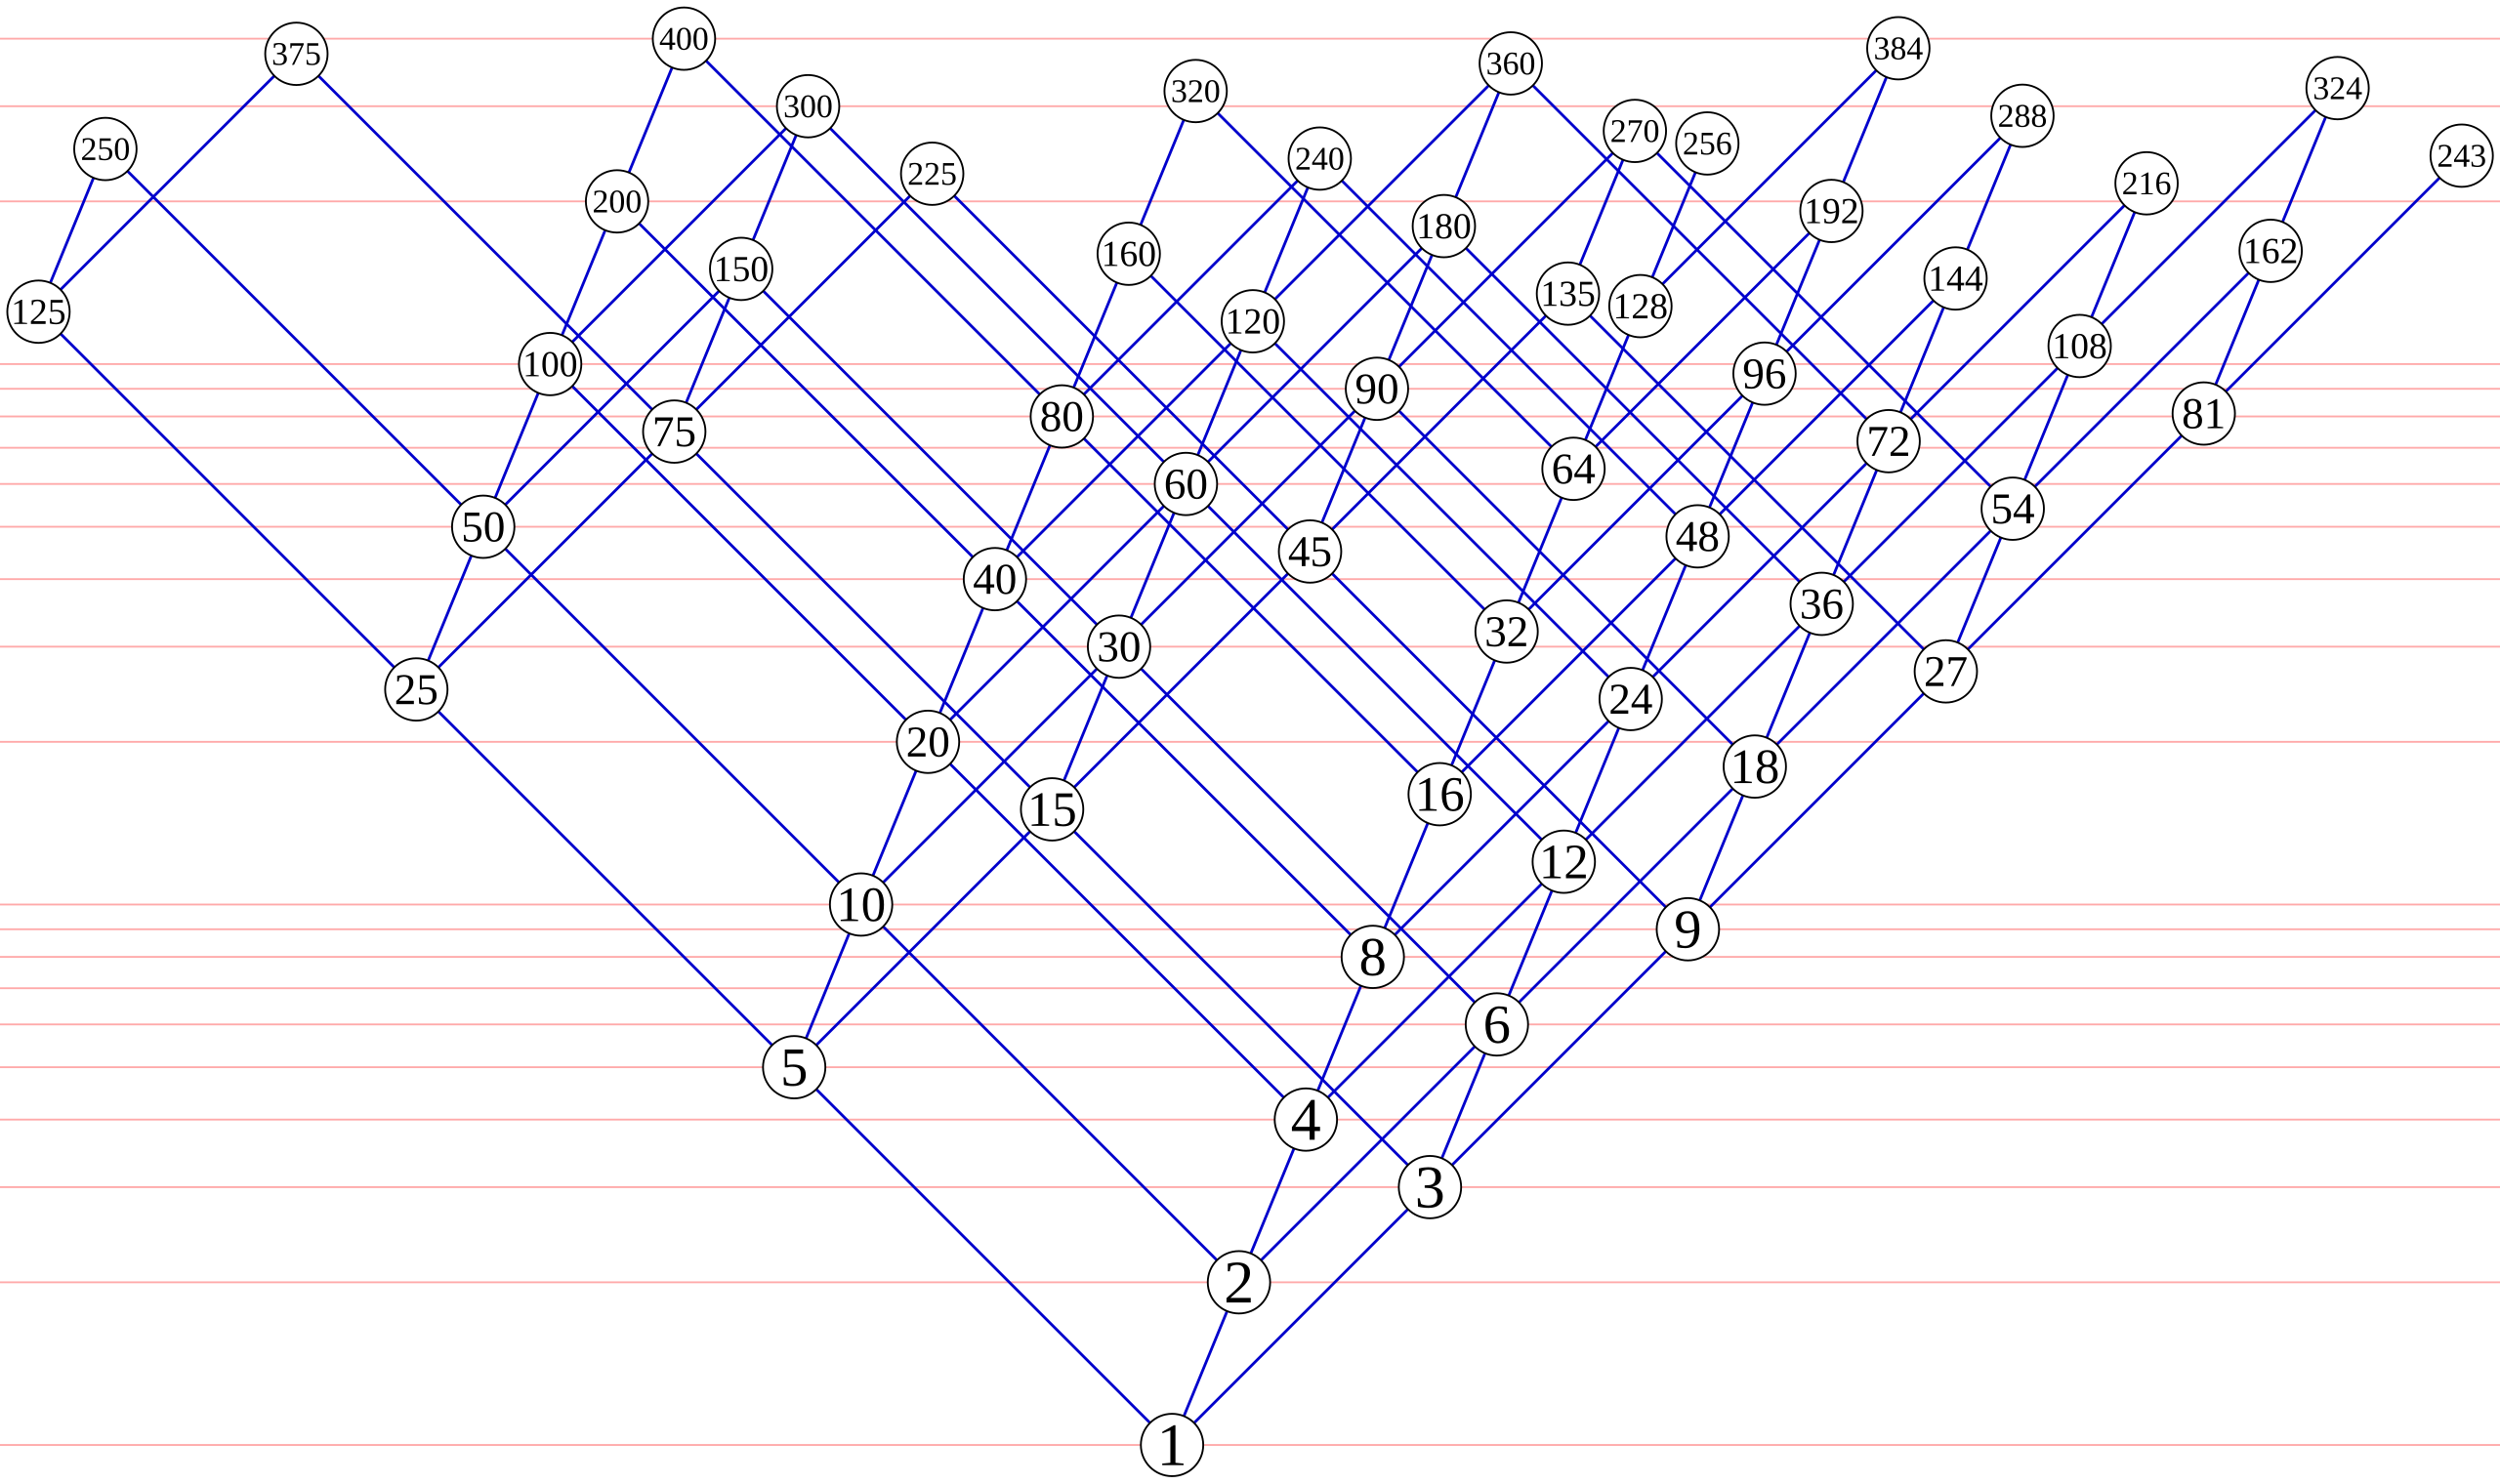
| 描述 | A Hasse diagram of divisibility relationships among regular numbers up to 400. As shown by the horizontal light red lines, the vertical position of each number is proportional to its logarithm. Inspired by similar diagrams in a paper by Kurenniemi [1]. |
| 日期 | 2007年3月14日 (原始上传日期) |
| 来源 | Transferred from en.wikipedia to Commons. |
| 作者 | 英语维基百科的David Eppstein |
许可协议
| 本作品已被作者英语维基百科的David Eppstein释出到公有领域。这适用于全世界。 在一些国家这可能不合法;如果是这样的话,那么: David Eppstein无条件地授予任何人以任何目的使用本作品的权利,除非这些条件是法律规定所必需的。 |
Source code
The Python source code for generating this image:
from math import log

limit = 400
radius = 17
margin = 4
xscale = yscale = 128
skew = 0.285

def A051037():
    yield 1
    seq = [1]
    spiders = [(2,2,0,0),(3,3,0,1),(5,5,0,2)]
    while True:
        x,p,i,j = min(spiders)
        if x != seq[-1]:
            yield x
            seq.append(x)
        spiders[j] = (p*seq[i+1],p,i+1,j)

def nfactors(h,p):
    nf = 0
    while h % p == 0:
        nf += 1
        h //= p
    return nf

seq = []
for h in A051037():
    if h > limit:
        break
    seq.append((h,nfactors(h,2),nfactors(h,3),nfactors(h,5)))

leftmost = max([k for h,i,j,k in seq])
rightmost = max([j for h,i,j,k in seq])
leftwidth = int(0.5 + log(5) * leftmost * xscale + radius + margin)
rightwidth = int(0.5 + log(3) * rightmost * xscale + radius + margin)
width = leftwidth + rightwidth
height = int(0.5 + log(limit) * yscale + 2*(radius + margin))

def place(h,i,j,k):
    # logical coordinates
    x = j * log(3) - k * log(5) + i * skew
    y = log(h)

    # physical coordinates
    x = (x*xscale) + leftwidth
    y = (-y*yscale) + height - radius - margin

    return (x,y)

print '''<?xml version="1.0" encoding="utf-8"?>
<!DOCTYPE svg PUBLIC "-//W3C//DTD SVG 1.1//EN" "http://www.w3.org/Graphics/SVG/1.1/DTD/svg11.dtd">
<svg xmlns="http://www.w3.org/2000/svg" version="1.1" width="%d" height="%d">''' % (width,height)

print '    <g style="fill:none;stroke:#ffaaaa;">'

l = 1
base = 1
while l <= limit:
    y = -yscale*log(l) + height - radius - margin
    print '        <path d="M0,%0.2fL%d,%0.2f"/>' % (y,width,y)
    l += base
    if l == 10*base:
        base = l

print "    </g>"
print '    <g style="fill:none;stroke-width:1.5;stroke:#0000cc;">'

def drawSegment(p,q):
    x1,y1=p
    x2,y2=q
    print '        <path d="M%0.2f,%0.2fL%0.2f,%0.2f"/>' % (x1,y1,x2,y2)

for h,i,j,k in seq:
    x,y = place(h,i,j,k)
    if i > 0:
        drawSegment(place(h//2,i-1,j,k),(x,y))
    if j > 0:
        drawSegment(place(h//3,i,j-1,k),(x,y))
    if k > 0:
        drawSegment(place(h//5,i,j,k-1),(x,y))

print "    </g>"
print '    <g style="fill:#ffffff;stroke:#000000;">'

for h,i,j,k in seq:
    x,y = place(h,i,j,k)
    print '        <circle cx="%0.2f" cy="%0.2f" r="%d"/>' % (x,y,radius)

# pairs of first value with size: size of that value
fontsizes = {1:33, 5:30, 10:27, 20:24, 100:20, 200:18}

for h,i,j,k in seq:
    x,y = place(h,i,j,k)
    if h in fontsizes:
        print "    </g>"
        print '    <g style="font-family:Times;font-size:%d;text-anchor:middle;">' % fontsizes[h]
        lower = fontsizes[h] / 3.
    print '        <text x="%0.2f" y="%0.2f">%d</text>' %(x,y+lower,h)
print "    </g>"
print "</svg>"
原始上传日志
The original description page was here. All following user names refer to en.wikipedia.
- 2007-03-14 05:08 David Eppstein 1363×809×0 (13167 bytes) A [[Hasse diagram]] of [[divisibility]] relationships among [[regular number]]s up to 400. Inspired by similar diagrams in a paper by Kurenniemi [http://www.beige.org/projects/dimi/CSDL2.pdf].
文件历史
点击某个日期/时间查看对应时刻的文件。
| 日期/时间 | 缩略图 | 大小 | 用户 | 备注 | |
|---|---|---|---|---|---|
| 当前 | 2010年3月13日 (六) 02:57 | | 1,363 × 809(13 KB) | David Eppstein | Fix fonts |
| 2007年7月24日 (二) 22:10 |  | 1,363 × 809(13 KB) | David Eppstein | {{Information |Description=A en:Hasse diagram of en:divisibility relationships among en:regular numbers up to 400. As shown by the horizontal light red lines, the vertical position of each number is proportional to its en:logarithm. In |
文件用途
以下页面使用本文件:
全域文件用途
以下其他wiki使用此文件:
- en.wikipedia.org上的用途
- hu.wikipedia.org上的用途
- kk.wikipedia.org上的用途
- ru.wikipedia.org上的用途
- sv.wikipedia.org上的用途