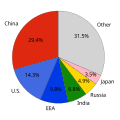
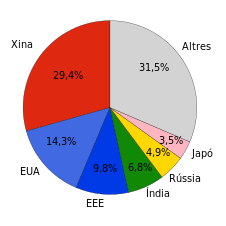
File:CO2 emission pie chart.svg
外观

此SVG文件的PNG预览的大小:540 × 540像素。 其他分辨率:240 × 240像素 | 480 × 480像素 | 768 × 768像素 | 1,024 × 1,024像素 | 2,048 × 2,048像素。
原始文件 (SVG文件,尺寸为540 × 540像素,文件大小:76 KB)
文件历史
点击某个日期/时间查看对应时刻的文件。
| 日期/时间 | 缩略图 | 大小 | 用户 | 备注 | |
|---|---|---|---|---|---|
| 当前 | 2024年1月31日 (三) 00:11 |  | 540 × 540(76 KB) | Manlleus | File uploaded using svgtranslate tool (https://svgtranslate.toolforge.org/). Added translation for es. |
| 2024年1月31日 (三) 00:02 |  | 540 × 540(62 KB) | Manlleus | File uploaded using svgtranslate tool (https://svgtranslate.toolforge.org/). Added translation for ca. | |
| 2024年1月30日 (二) 23:59 |  | 540 × 540(37 KB) | Manlleus | fixed text labels for translation | |
| 2017年6月8日 (四) 04:17 |  | 540 × 540(54 KB) | Illegitimate Barrister | Centering. | |
| 2017年6月8日 (四) 04:15 |  | 540 × 540(36 KB) | Illegitimate Barrister | WP:NOTUSA | |
| 2017年6月8日 (四) 01:34 |  | 540 × 540(30 KB) | ArniDagur | fixed wrong upload | |
| 2017年6月8日 (四) 01:32 |  | 540 × 540(30 KB) | ArniDagur | lines made black and smaller, font size increased, general improvements | |
| 2017年6月8日 (四) 00:41 |  | 720 × 540(30 KB) | ArniDagur | made font bigger | |
| 2017年6月8日 (四) 00:18 |  | 720 × 540(30 KB) | ArniDagur | User created page with UploadWizard |
文件用途
以下页面使用本文件:
全域文件用途
以下其他wiki使用此文件:
- bn.wikipedia.org上的用途
- ca.wikipedia.org上的用途
- ckb.wikipedia.org上的用途
- cy.wikipedia.org上的用途
- da.wikipedia.org上的用途
- en.wikipedia.org上的用途
- es.wikipedia.org上的用途
- fr.wikipedia.org上的用途
- ha.wikipedia.org上的用途
- hu.wikipedia.org上的用途
- hy.wikipedia.org上的用途
- ig.wikipedia.org上的用途
- it.wikipedia.org上的用途
- ka.wikipedia.org上的用途
- ms.wikipedia.org上的用途
- or.wikipedia.org上的用途
- pt.wikipedia.org上的用途
- ro.wikipedia.org上的用途
- ru.wikipedia.org上的用途
- ru.wikinews.org上的用途
- so.wikipedia.org上的用途
- te.wikipedia.org上的用途
- uk.wikipedia.org上的用途
- uz.wikipedia.org上的用途
- vi.wikipedia.org上的用途
- www.wikidata.org上的用途


