
File:2011- Renewable energy capacity - International Energy Agency.svg

此SVG文件的PNG预览的大小:800 × 450像素。 其他分辨率:320 × 180像素 | 640 × 360像素 | 1,024 × 576像素 | 1,280 × 720像素 | 2,560 × 1,440像素 | 1,200 × 675像素。
原始文件 (SVG文件,尺寸为1,200 × 675像素,文件大小:4 KB)
摘要
| 描述 |
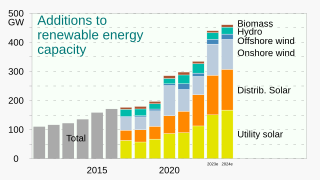
English: Bar chart (column graph) of the number of gigawatts of w:renewable energy capacity (2011- ), as reported by the w:International Energy Agency.
|
||
| 日期 | |||
| 来源 | 自己的作品 | ||
| 作者 | RCraig09 | ||
| 其他版本 |
|


许可协议
我,本作品著作权人,特此采用以下许可协议发表本作品:
本文件采用知识共享署名-相同方式共享 4.0 国际许可协议授权。
- 您可以自由地:
- 共享 – 复制、发行并传播本作品
- 修改 – 改编作品
- 惟须遵守下列条件:
- 署名 – 您必须对作品进行署名,提供授权条款的链接,并说明是否对原始内容进行了更改。您可以用任何合理的方式来署名,但不得以任何方式表明许可人认可您或您的使用。
- 相同方式共享 – 如果您再混合、转换或者基于本作品进行创作,您必须以与原先许可协议相同或相兼容的许可协议分发您贡献的作品。
文件历史
点击某个日期/时间查看对应时刻的文件。
| 日期/时间 | 缩略图 | 大小 | 用户 | 备注 | |
|---|---|---|---|---|---|
| 当前 | 2023年9月29日 (五) 10:15 | | 1,200 × 675(4 KB) | Jirka Dl | Reverted to version as of 21:33, 25 August 2023 (UTC) - translation will be in separate file |
| 2023年9月6日 (三) 08:00 |  | 1,200 × 675(6 KB) | Jirka Dl | File uploaded using svgtranslate tool (https://svgtranslate.toolforge.org/). Added translation for cs. | |
| 2023年8月25日 (五) 21:33 |  | 1,200 × 675(4 KB) | RCraig09 | Version 5: update to include data, and projected data, for 2024 | |
| 2022年9月15日 (四) 20:17 |  | 1,100 × 700(3 KB) | RCraig09 | Version 4: update with data through 2021 | |
| 2021年5月13日 (四) 20:01 |  | 1,063 × 750(3 KB) | RCraig09 | Version 3: reversed positions of Solar and Wind since Wind showed the greatest increase from 2019 to 2020. . . . Made colors more subdued. | |
| 2021年5月12日 (三) 01:56 |  | 1,063 × 750(3 KB) | RCraig09 | Version 2: Breaking down 2019 and 2020 components . . . Changing title to be more precise | |
| 2021年5月11日 (二) 22:10 |  | 1,000 × 750(2 KB) | RCraig09 | Uploaded own work with UploadWizard |
文件用途
以下页面使用本文件:
全域文件用途
以下其他wiki使用此文件:
- bn.wikipedia.org上的用途
- cs.wikipedia.org上的用途
- en.wikipedia.org上的用途
- ig.wikipedia.org上的用途
- ko.wikipedia.org上的用途
- 지속 가능한 에너지
- 사용자:이강철 (WMKR)/심사/기후변화 문서보강 프로젝트/Scottkim06/지속 가능한 에너지/4월 14일
- 사용자:이강철 (WMKR)/심사/기후변화 문서보강 프로젝트/Scottkim06/지속 가능한 에너지/4월 19일
- 사용자:이강철 (WMKR)/심사/기후변화 문서보강 프로젝트/Scottkim06/지속 가능한 에너지/4월 21일
- 사용자:이강철 (WMKR)/심사/기후변화 문서보강 프로젝트/Scottkim06/지속 가능한 에너지/4월 22일
- 사용자:이강철 (WMKR)/심사/기후변화 문서보강 프로젝트/Scottkim06/지속 가능한 에너지/4월 23일
- 사용자:이강철 (WMKR)/심사/기후변화 문서보강 프로젝트/Scottkim06/지속 가능한 에너지/4월 24일
- 사용자:이강철 (WMKR)/심사/기후변화 문서보강 프로젝트/Scottkim06/지속 가능한 에너지/4월 29일
- 사용자:이강철 (WMKR)/심사/기후변화 문서보강 프로젝트/Scottkim06/지속 가능한 에너지/4월 30일
- no.wikipedia.org上的用途
- uz.wikipedia.org上的用途
- zu.wikipedia.org上的用途